Introduction
There is no IT infrastructure that doesn’t break down at one point or the other, the ability to identify and promptly fix the problem in a networking infrastructure is crucial to the running of the organization. The IT professional must be able to identify and fix problems. To do this, some tools can help you help do this.
This article explores the essential troubleshooting tools that every network professional should be familiar with. They will range from basic tools you may be familiar with to advanced analyzers to help you troubleshoot a network.
Troubleshooting tools are essential tools for every IT professional as the bulk of the work of many network professionals is troubleshooting. The tools described in this blog are for free and are available on most Operating Systems. The following are some troubleshooting tools you should know as an IT professional;
1. Ping
Ping (Packet Internet or Inter-Network Groper) is a network program or command that is used to test if your computer can reach a specified IP address or if the particular IP address even exists in your network. It is one of the most common network troubleshooting tools to check the connectivity of your local device to other IP destinations (device or interface).
Pings are routable over the internet and as such you can use them to test the reachability of remote devices. It is compatible with most OS such as Windows, Mac OS, Linux, Switches, Routers, Firewalls, Servers etc.
The Ping Command uses ICMP (Internet Control Message Protocol) to deliver packets to a local or remote node. The ICMP consists of two parts – ICMP Echo Request and ICMP Echo Reply. Similar to the way a Sonar (underwater navigation mechanism) sends out ultrasonic waves and gets a response reflected if there is an object on its path. When you issue a Ping command, an Echo Request is sent to the destination node or interface, if it is reachable, an Echo Reply is sent back to confirm that it is reachable.
How To Ping
To ping a device, open up the command prompt (or Powershell )and issue the command ” ping” followed by the IP address of the device you want to ping. e.g. ping 192.168.43.72 and then press the “enter” button to execute. Some ping commands are in the diagram below.
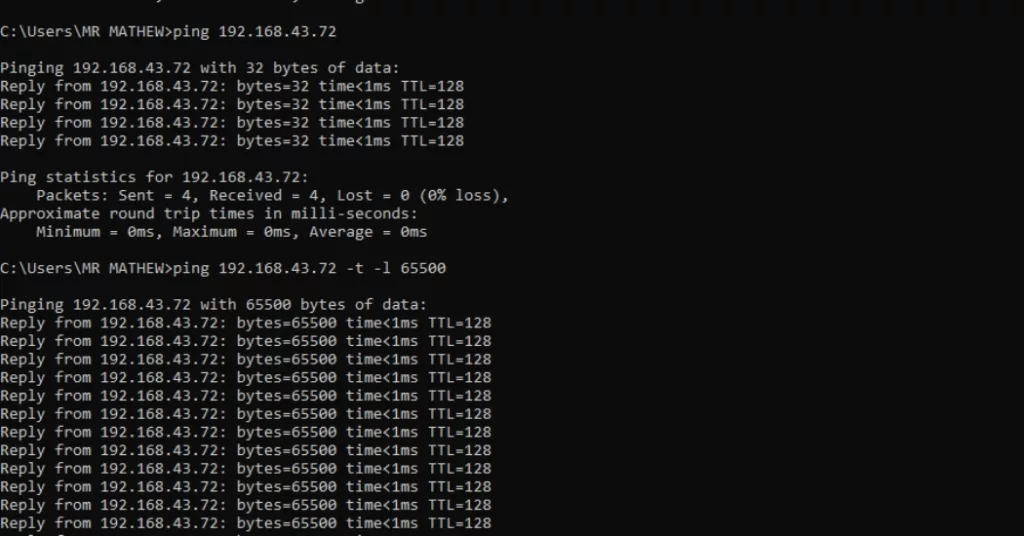
You can also ping a device using its domain name. The command above will typically deliver 4 Echo replies with a default payload of 32 bytes in Windows.
To get continuous pings that do not time out, the command is ” ping IP address – t“. To ping a device with load, the command is “ping IP address -t -l load” e.g. ping 192.168.43.72 -t -l 6550, where the load is 65500 (maximum payload). Pings with loads are very useful to test network performance. When you apply a load to the network that is performing poorly, it will time out or return a response that has a very large latency (high ms value).
The command to end the continuous pings is simply Ctrl C.
Use Cases of Pings and Benefits
When you ping a device and you get a response it means that the device is reachable or is active. It also shows that the device is in your network and that there is a possible route from your device. The common uses of pings as a troubleshooting tool are
- To test network connectivity both for local and remote devices
- To test and analyze network performance using the latency. Low latency indicates good performance
- To test if your Network Interface card is working fine
- To resolve DNS issues such as name resolution.
Note that firewalls can block ping requests and make the ping command ineffective in testing connectivities with other nodes.
Interpreting Ping Results
When you get a reply to your ping, it shows that the device is in your network and is reachable. This is a useful information when you are troubleshooting.
You can ping devices from different points in the network to isolate where there may be a break in the network. Some common ping issues and their interpretations are as follows;
Request Time Out – This means that the device you are trying to reach is not responding to pings. It means that the device doesn’t exist, is not in your network, or is simply the power is off.
Ping Could Not Find The Host – This means that your computer could not resolve a hostname to an IP address. So there is a DNS issue that needs fixing.
Destination Unreachable – This means that a route to the system you are pinging is not available. It may be that there is no default gateway or a problem with the local host.
Sometimes, you get pings that are successful but are intermittently failing or having high latencies. They usually indicate poor performance of the network and causes can range from bad cables, broken NIC, problems with the routers or switches, misconfigured Duplex, speeds, frequencies, etc.
2. Traceroute
A Traceroute (or Tracert) is a command-line tool that is used to show the route or pathway that a data packet takes as it travels through the network. It maps out the exact path that the data packet uses as it moves from the sender to the final destination.
Traceroute is similar to the ping command except that it provides a piece of much more detailed information. Traceroute also uses the ICMP (Internet Control Message Protocol) for Windows, Cisco devices use UDP while Linux can use UDP, TCP, or ICMP.
A traceroute does not just ping the final destination but also all the routers that are on the path to the final destination. It returns a reply for each hop along the path to the final destination and is therefore able to create a map of the pathway. It also measures the roundtrip time from each router to the destination as the data packet transverses the network.
Unlike Ping, however, Traceroute sends out each successive ICMP request with an incremental TTL (Time to live) value, starting from 1 to a maximum value of 30. Each TTL represents the number of hops to reach the final destination.
The maximum number of hops allowed is 30, after which the packet is dropped. The number of ICMP requests sent to each router is 3, some of which may fail, and after each Hop, the TTL decreases by 1 till it is dropped at zero. (See the diagram below for the 3 different latencies for each hop count)
How To Run The Traceroute
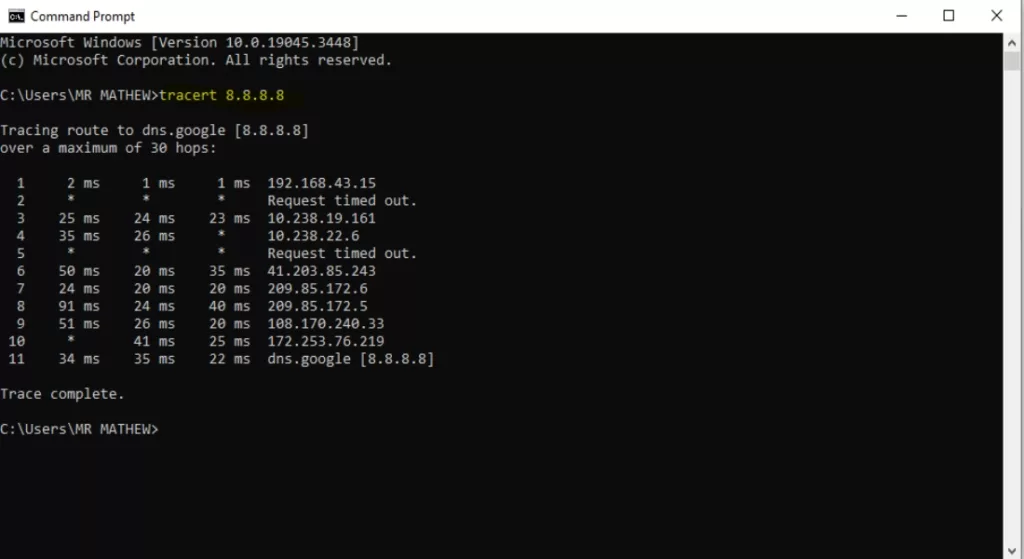
To run the traceroute tool, open the command prompt of your device and issue the command “tracert” followed by the IP address of the destination or its hostname name. For example, “tracert 8.8.8.8” or “tracert google.com” and then hit the Enter tab.
The screenshot below shows the number of Hops in the first column, the next 3 columns are the latencies for each of the 3 requests to each router, while the last column indicates the IP address of the router at that Hop.
The Usefulness of Traceroute
Traceroute is used to determine the time it takes for data packets to travel through each router, the number of routers in the path and identify any points of congestion in the network. It is one of the simplest troubleshooting tools that you can use to gain deeper insights into the network.
You can use Traceroute to generate a map of the network and identify specific routers where there are bottlenecks in the network. Such network bottlenecks will have latencies at the specific hop.
3. NSLookup
Nslookup or name server lookup is a command line tool that is used to do DNS queries and resolve IP addresses or other DNS records. It does exactly what the DNS resolvers are doing i.e. sending queries to DNS Server to get which IPs are associated with a domain name or other DNS records. It is used for troubleshooting DNS-related problems.
When troubleshooting a network for DNS-related issues, there are two modes of Nslookup you can use; the Interactive mode and the Noninteractive or Command mode. The Interactive mode is used when you need to check data or set several configurations i.e., query various hosts and domains. Y
ou can run the Interactive mode by typing the “nslookup“ without the domain name. This will keep the session open for you to execute other commands e.g. entering a domain name. The non-interactive or command mode is used when you just need to look at a single piece of data. In this mode, the names and information displayed are for a specified host. They are for one domain name.
NSLookup Commands
The NSlookup is preinstalled on most Operation systems. To issue the NSlookup command, go to your Command prompt and simply type “nslookup“. This is followed by the name of the domain or IP address you want to query (noninteractive mode).
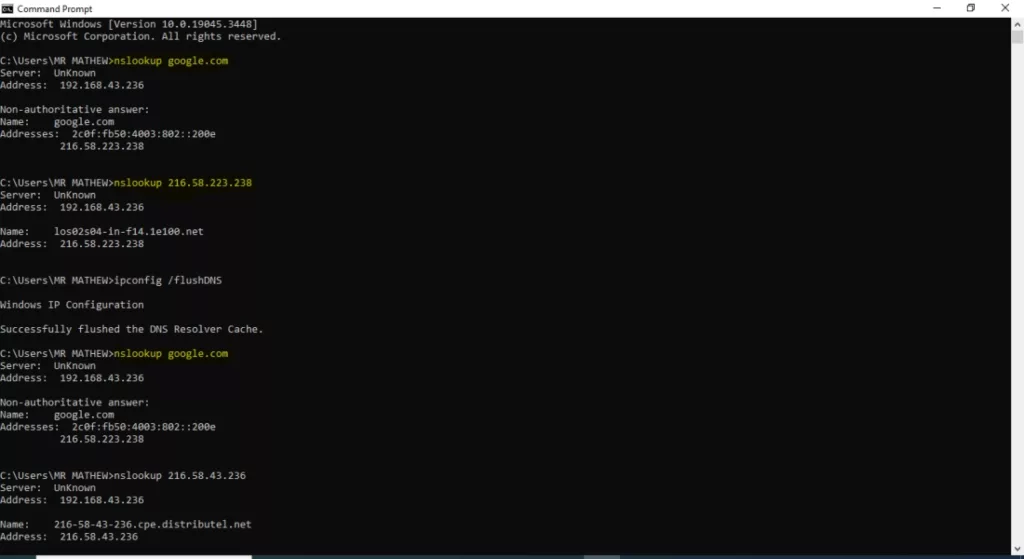
For example; “nslookup google.com” is shown below. This will show the IP addresses (IPv4 and IPv6) that are mapped to the google.com domain. Executing just the nslookup command (without the domain name) opens interactive mode. You can then make queries for a domain name (google.com) in this instance.
To get a complete list of all the commands, simply issue the command “help” from the interactive mode. i.e. Type nslookup in the command prompt, press Enter to execute, then type help to display the list of available commands you can use to troubleshoot.

The non-authoritative answer in the output indicates that the results are from cache records, rather than from active DNS servers. It may be important to clear caches when troubleshooting with nslookup to be sure that results are up to date.
The Authoritative answer is from active DNS servers if the cache is empty. To clear the DNS cache, execute ‘ipconfig /flushdns” from the command prompt.
Use Cases of NSLookup
The nslookup command line tool is used to troubleshoot common DNS-server-related problems. The common uses are as follows;
- To find the IP address associated with a host e.g. execute nslookup google.com in the command prompt
- To find the domain name of an IP address (reverse nslookup)e.g. execute nslookup 216.58.223.206 will print google.com
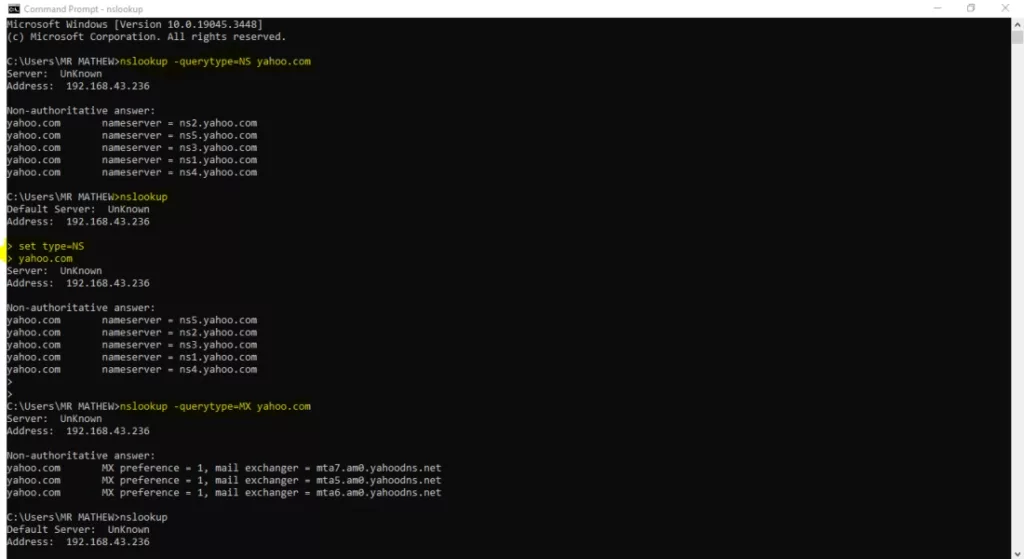
- To find the name servers for a host in the network e.g. from the Interactive mode, execute “set type=NS”, then execute the domain name. (See screenshot for yahoo.com name servers) or nslookup -querytype=NS yahoo.com
- To find the mail server for a domain e.g. from the Interactive mode, execute “set type=MX” (See screenshot for yahoo.com Mail exchange records) or nslookup -querytype=MX yahoo.com (noninteractive mode)
4. Iperf
Iperf is a tool to measure the bandwidth and throughput between two devices. It is a free and open-source Linux tool that pushes UDP, TCP, or SCTP traffic between two devices or nodes. Iperf is available on all major Operating Systems such as Windows, Mac OS, Android, Linux, etc.
Iperf is valuable to an IT professional for monitoring and testing the bandwidth between two devices.
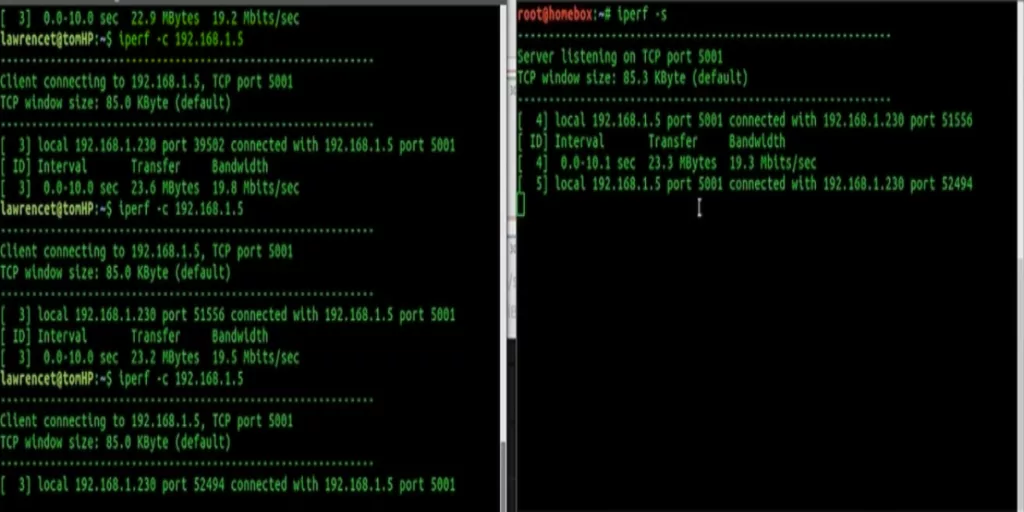
When running an Iperf test between devices, the one sending the traffic acts as the client, while the other device receiving the traffic is the server. It thus uses the server-client model. You can access Iperf through the Command line (CLI) or the GUI.
Iperf Versions (iperf2 v iperf3)
There are two common versions of Iperf; Iperf v2 and Iperf 3. It is important to distinguish between the two versions as they are not compatible. Iperf3 is the newer version and it is not backward compatible with the earlier version. You cannot perform a successful Iperf test if the client and the server are not running the same versions.
Iperf 2 has support for running tests from multiple clients on a single server and is usually for testing Wi-Fi speed. Iperf 3 is better at running a bi-directional bandwidth test(i.e. reverse Iperf speed or bandwidth test).
Iperf uses the same existing link to send traffic to and fro between the server and the client. (Iperf2 creates a new link for the reverse direction which NAT translations may block). Iperf 3 is better for testing networks.
How to Measure Bandwidth with Iperf
To measure the bandwidth between two devices, you must install the Iperf client and server separately on the two devices (and must be the same versions). To download and install Iperf, visit here. You can opt to only install the Iperf client on your device and then connect to any of the public Iperf servers to test your network bandwidth. This may not be as accurate as setting up your private Iperf server.
To connect and measure the bandwidth, open the command line of the client(or use GUI) and type the command “iperf -c” followed by the IP address of the server. While on the server type the command “iperf -s” for the server to listen to the client requests as shown below. Iperf 2 client uses port 5000-5009 while the server listens on ports 5200–5209.
Running tests consumes actual bandwidths (cost) and it is preferable to run test intervals.
Use Cases for Iperf
Iperf measures bandwidth or throughput between two nodes. The following are some of the common use cases of Iperf
- Stress-testing your network during deployment or upgrade.
- Troubleshooting tool for network performance and optimization
- As a Continuous monitoring tool for your network (security and performance). You can set up an alarm or notification system to indicate when the traffic reaches a certain traffic threshold or when there is an unusual traffic surge or drop.
5. Wireshark

Wireshark is a network protocol/packet analyzer that allows you to inspect traffic that is going through your network. It captures network traffic and reveals important details about the network that you can use to analyze the network performance and address security concerns.
Wireshark is an open-source networking and security tool, its release is under the GNU General Public License. It is available on major operating systems such as Windows, Mac OS, Linux, etc. It is accessible both through the command line and through the system GUI.
Download and installation of Wireshark is available here
Successful installation of Wireshark will add information to your network adapter. It also installs a npcap loopback adaptor which is useful in sniffing loopback packets.
Capturing and analyzing network packets
To capture traffic, simply click on the installed Wireshark software, and choose your preferred interface (adaptor) to capture network traffic. You can specify the type of traffic you want to capture by using filters.
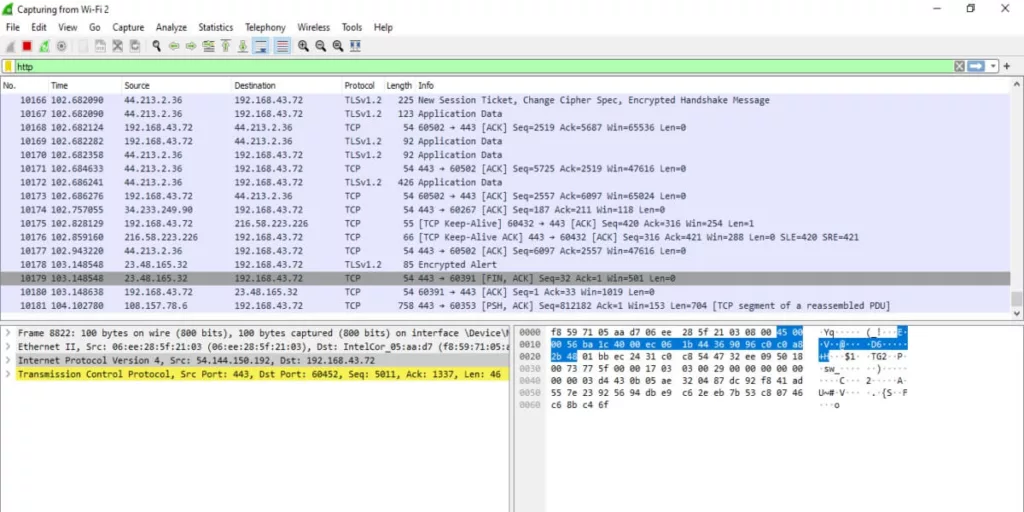
Wireshark displays the packets in three different panes so that it is easy to analyze the packets. You can click on each pane to see further details.
The first pane displays the individual packets in rows and will include information such as the protocol, the source and destination IP addresses, packet number, and other payload information. The second pane displays further details such as the data link and some network information.
The third pane will show the ASCII and HEX information for any highlighted segment. See diagram below;
Uses of Wireshark
Wireshark is a powerful packet analyzer and security tool for IT professionals. Some of the common uses of Wireshark include;
- It is a great tool for troubleshooting network problems by analyzing the network traffic in detail.
- It is used in system administration to know how packets are being routed in the local LAN, to know if the system is running efficiently or, if the network is down
- Wireshark has great utility in security administration to identify malicious traffic, both for live capture and for forensics.
- You can use Wireshark to identify devices that are transmitting the most traffic and peak periods.
- It is an ethical hacking tool.
6. NMAP (Network Mapper)
NMAP is an advanced network scanner, open-sourced and available for free on most Operating systems such as Windows, Mac OS, and Linux. It is both a network monitoring tool as well as a hacking tool.
You can use it to perform security audits and scan the network for the list of all the available or active devices, discover which ports are open, the operating systems that such devices are using as well as the programs that are running on those devices.
NMAP is one of the most sophisticated network scanning tools that are available for free and should be among the toolkits of every IT professional (network administrators, ethical hackers, penetration testers, etc).
Unlike Pings for example, where you can only test the reachability of a single device with each ping, NMAP can simultaneously check all the devices that are on your network within seconds and can help you discover rogue or shadow IT in your network.
The download and installation for NMAP is available at https://nmap.org/download
Scanning for Open Ports and Services
To scan your network, open up a terminal and issue the command “nmap -h” which is the help command to give you basic information about nmap switches and their descriptions. More details are available in the man file, accessible with the “man nmap” command.
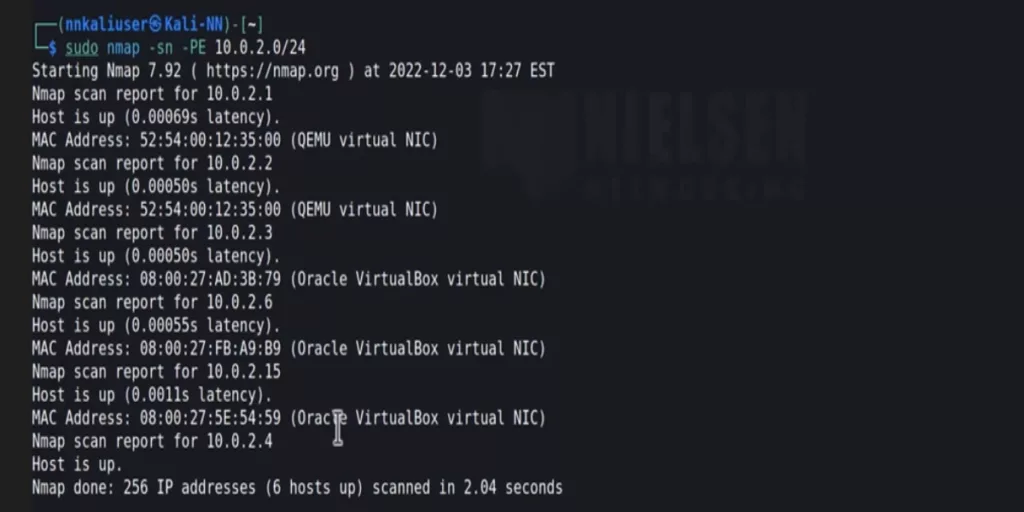
To do a discovery test of devices on the network, use the command “nmap -sn x.x.x.x” where x.x.x.x is the IP subnet range with /notation or use “sudo nmap -sn -PE x.x.x.x” (with root privileges) to show all the devices in the network.
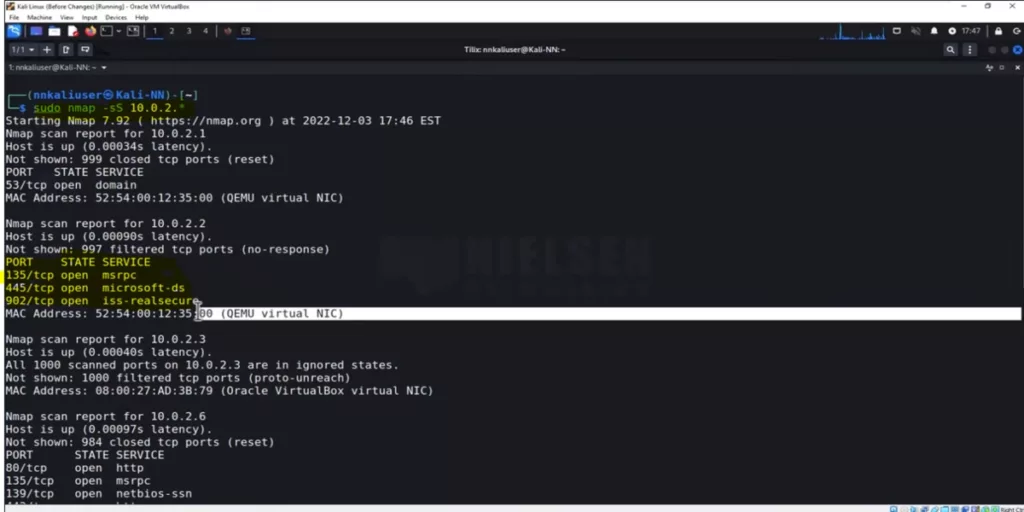
Meanwhile, to show all the open ports, and the protocol running on them, the nmap command “sudo nmap -sS x.x.x.x” is applicable. (x.x.x.x is the subnet of your network)
You can the list of all commands using the help function. or download a copy of all the NMAP command cheatsheet here
Uses of NMAP
Some of the common use cases for NMAP are as follows
- For performing security audits
- NMAP is a great tool for scanning all IPs in a network when you want to make an inventory of all devices in your network
- To find vulnerabilities in the network and to identify malicious devices.
- It is used for finding open ports, in the network, the OS of each device, and the programming they are running.
- NMAP has a scripting engine that can be used to automate ethical hacking processes, for reconnaissance on devices.
Security implications and ethical use of Nmap
NMAP is a very powerful network scanner that has the ability to reveal vulnerabilities in the network. It can reveal very sensitive information that can be used for malicious intent.
It is important to note that this has serious security implications. You should use it on networks on which you have permission or for ethical hacking. There may be legal implications for using NMAP outside these boundaries.
Conclusions
Network administrators/engineers and IT professionals who work in network or security-related roles should be familiar with troubleshooting tools. Some of the common tools that can help in day-to-day jobs are as follows; Pings to test network connectivity, Traceroute to map out a network, identify the number of routers and bottlenecks in the network, Nslookup to troubleshoot DNS-related issues and Iperf to measure network bandwidth
Wireshark captures and analyzes network traffic as well as identifies malicious traffic, NMAP is an advanced scanner to checks active devices, open ports, type of OS of devices in the network.
Additional Resource
1. https://phoenixnap.com/kb/nslookup-command
2. https://nmap.org/book/man.html
Read