
Introduction
According to a renowned Mathematician and Data Scientist Entrepreneur;
Data is the new oil, it is valuable, but if it is not refined, it cannot really be used”.
Clive Humbly
This statement echoes the significance of Data and Data Analytics in the modern economy. It also highlights the importance of “refining” such Data for it to be valuable. Data Analytics as one of those “refining” processes for Data, will be the focus of this blog. It will explore the key aspects of Data Analytics as it relates to career opportunities and what you generally need to know if you are hunting for a career fit.
Whether you are considering a career as a Data Analyst, Data Scientist, Data Engineer, or in any field that deals with Data, there is a need to understand the broad concept of Data Analytics to make informed choices and perhaps make your Data-centered career path much easier to navigate.
What is Data Analytics

Data Analytics is the process of analyzing raw data to pull out useful insights. This analysis will involve querying, interpreting, and visualizing( presenting) such data in a way that is easy for humans to understand. It is a specialization of Data Science and employs statistical tools and techniques to analyze and interpret raw data to draw actionable insights.
Data Analytics is important to companies as it helps them make informed decisions that are backed by data. It may for example help them understand better how or why customers interact with their product in a certain way and can them make adjustments to better customer experience and achieve their business goals.
Difference Between Data Analytics and Data Analysis
It is not uncommon to use the terms “Data Analytics” and “Data Analysis” interchangeably, however, there are marked differences between these two terms. Data Analysis is the process of studying data to find answers to “how” and “why” things happened in the past. For example; how were the sales of goods in June or why was there a drop in sales in July? The result of Data Analysis finer or smaller datasets, a pattern or detailed report that is different from the larger chunk of data. It is usually for an event that has happened in the past.
Data Analytics, on the other hand, takes a dataset or the results of the Data Analysis and processes them, to find out the events that are likely to occur in the future. For example, making recommendations for product purchases to customers based on the findings that they spend more time reviewing certain products. That may be because there is a correlation between the variable time spent reviewing a product and a customer’s interest in buying a product.
The Role of Data Analytics?
Data Analytics is generally used by businesses to make faster and better business decisions, reduce costs (and wastages associated with the trial and error method), promote innovations, improve efficiencies, etc., All businesses generate and use data, and they can benefit from Data Analytics. Some very specific examples of the role of Data Analytics include;
- In Consumer goods, It is used in predicting future sales and customers’ purchasing behavior.
- In Advertisement, to analyze the effectiveness of marketing campaigns.
- In finance, it helps in security and in protecting against fraud.
- To boost customer acquisition and retention etc.
Types of Data Analytics
Data Analytics helps you understand insights into a given Dataset and help you make informed decisions based on those insights. There 4 types of Data Analytics, these are;
- Predictive Analytics – This types of Data Analytics help you identify trends, correlations, and causations within a given Data Set. For example, in consumer goods, how is the demand for particular goods likely to be impacted by the launch of a similar product with similar features? It answers the question of “What might happen?”
- Prescriptive Analytics – This predicts the likely outline of an event or process and then makes decisions or recommendations. It answers the question of ” What should we do next?”
- Diagnostic Analytics -This is focused on finding out the reason an event occurred – and diagnosing the cause of an event. It answers the question “What did an event happen?”
- Descriptive Analytics -This describes the qualities and quantities of a dataset. It simply answers the question “What happened ?”.
Key Skills In Data Analytics
Many skills are involved in Data Analytics. These include both Technical and non-technical skills. The following are some key aspects or skills that are required for an in-depth Data Analytics process. These are ;
1. Data Preparation Skill
Data Preparation skills take into account your ability to work with different Data Sources such as spreadsheets, webpages, SQL databases, etc. You will also need to know how to do Data Cleaning, your ability to spot and remove errors, blanks, and duplicates, input ommissions, or missing values. It is difficult to have good Data analytics without first cleaning up your data.
Data Preparation skills also include Joins and Mergers, which deal with combining data from different sources into a single dataset for analytics, and Data Transformation skills to put data in a format that you can manipulate.
2. Number Crunching Skills
Number crunching skills are the ability to manipulate numbers in different ways, They include skills like Statistical analysis to calculate basic operations like mean, average, median, etc. Other number crunching skills Functionals analysis (learn the specifics interest in your industry e.g Insurance actuary), Ad-Hoc analysis, and Experimental analysis to determine the outcome of certain experiments or tests.
3. Story Telling Skills
The focus of “story-telling” skills is to be able to present your findings from the analytics to your employer. Visualizing it in an easy-to-understand format. Here you determine the type of charts or “visuals” that tell the story best. Your story-telling skills should present your findings beautifully, interestingly, and persuasively. It should have the goal of warranting a response. It requires good communication skills.
4. Ability To Asking The Right Questions
Your ability to ask the right questions can be the key to unraveling some key insights in Data analytics. After all, the goal of Data Analytics is to answer specific questions. Questions such as the purpose or motivations of any given analysis can help steer the process in the right direction, removing what is not needed and focusing on what may be helpful to an organization. Know more about the organization you work for to be able to ask the right questions.
5. Programming and Technical Proficiency
Some technologies or tools make Data analytics possible. These include Excel sheets, Tableau, and programming languages like Python, and R. Technology skills are an important component of Data analytics as the practicality of analytics without tech skills is impossible.
Some collection of resources that can help you practice some of the technology skills are available here
6. Domain Knowledge
It is possible to draw different conclusions from a given dataset. Some information is only relevant or useful in certain industries. Domain knowledge demands that you are knowledgeable about the industry you work in, and know the information that is relevant to them. While a financial firm may be interested in detecting fraud from a given dataset, a Marketing firm will be interested in customers’ feedback and sales performance.
Popular Roles/Jobs in Data Analytics
A. Data Analyst

The Data Analyst specializes in Data Analytics, using statistics and tools to draw insights from raw data. They analyze data and then visualize them so that companies can use such data to make informed based on the insights gained. Some of the typical job descriptions, according to popular job posts on Linkedin and Indeed.com include the following;
- They collect, clean, and preprocess data from various sources to ensure accuracy, completeness, and consistency.
- They create and experiment with new ideas that will engage and excite both staff and business customers, and ultimately increase profit and productivity
- They continuously monitor, safeguard the integrity and confidentiality of data, and make the necessary adjustments if necessary.
- They Perform exploratory data analysis to identify trends, patterns, and outliers and make recommendations based on the outcomes.
- They extract data using tools and use them to answer specific questions that will improve business and productivity.
- They assist in preparing reports and conducting research for the business stakeholders
Salary of A Data Analyst
The average salary of a Data Analyst in the US is $76,826/year (according to Indeed). The typical range is $49,000 for beginners to about $120,000 for Experienced Data Analyst. Top companies like Meta, Stripe, and Google can pay as much as $163,000/year on average. It should be noted that most persons usually transition to other roles like Data Scientist or Engineer after a couple of years as a Data Analyst.
B. Business Intelligence (BI) Analyst
The Business Intelligence analyst ( or simply BI) is an expert who specializes in harnessing all the data that a business generates in all its activities and then analyzing them, to insights that can help a business make smarter decisions. The BI analyst will spot trends, correlations, and anomalies from the business dataset. They can identify opportunities, and threats, answer specific business questions, etc by using data from the business – financial data, sales data, customer surveys, marketing data, etc.
For the BI analyst, the focus is on both current and historical data, and those data are business-related, such as financial data, sales data, marketing data, customer surveys, etc, They visualize their findings and present them in a way that is easy for stakeholders to read.
There is a growing demand for Business Intelligence Analysts as businesses are finding ways to stay ahead of their competitors. The projected growth for the Industry is about 11 percent (CAGR) from 2023-2032 (According to Yahoo Finance)
The average salary of a Business Intelligence Analyst in the US is about $80,000/year – 115,000/year (Glassdoor).
C. Machine Learning (ML) Engineer

The Machine Learning Engineer is an expert who uses Machine Learning to bring practical solutions to improve a business. He brings to practical use the knowledge of Data science and Machine learning to solve problems. This may come in the form of building specific features in a product or automating workflows. You use ML when you have a large volume of data, containing complex variables that it difficult to analyze.
For example, you want your driving app to be able to predict accurately how long it will take to move from point A to B, many factors like traffic congestion, route, time of the day, speed of the car, weather conditions, etc. can impact this. The ML Engineer will build predictive models to solve the challenge and then incorporate such models into a product as a microservice.
Machine learning Engineering is a Specialty role. The average salary for an ML Engineer in the US is about $125,000-$186,000/year (Glassdoor).
D. Data Scientist (DS)
Data science generally covers anything that has to do with Data – collecting, analyzing, modeling, application, etc. As it relates to a job role, a Data Scientist is an expert whose job it is to create impact from data. Such impact is to help organizations solve problems, generate insights, get product recommendations, etc. A Data Scientist finds patterns in large datasets, creates and trains machine-learning models, deploys AI applications, etc.
Tasks a Data Scientist does often will depend on the size and priority of the company. This will differ for start-ups and large corporations. A small startup for example will focus on data collection, analytics, etc while large cooperations will involve much more specialized roles like AI and Machine learning.
In the US, the average salary of a Data Scientist in the US ranges from $131,000 -$189,000/year (Glassdoors).
Industries and Sectors Utilizing Data Analytics
Every industry uses data and can benefit from Data Analytics, some of the common examples that employ Data analysts are as follows;
A. Data Analytics in Finance and Banking
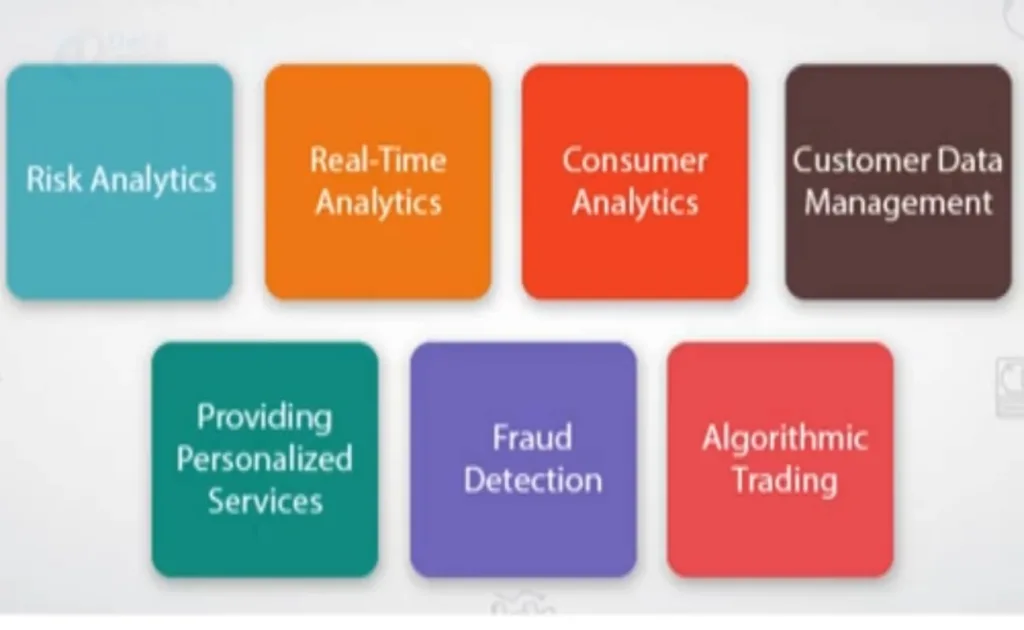
In Banking and Finance, Data Analytics is used in determining Risks such as credit risk (Risk Analytics), fraud detection, Customer analytics to know which customers are more profitable and then pay more attention to them, Provision of personalized services, Customer Data Management, Real-time analytics to monitor transactions, etc.
Data Analytics is also used in Algorithmic Trading which is heavily reliant on data. It is used for example in predicting the future prices of stocks (Time-series analysis to identify trends, seasonality, recognize patterns, etc.).The Job Title here is that of a Financial Analyst
B. Data Analytics in Healthcare
Healthcare is one of the Industries with the largest repository of Data – Medical Health Records of patients. There are a lot of technical gaps in healthcare data management that Data analytics is currently addressing. From the implementation of Electron Health records, and management of such systems to healthcare Insurance. Some common job titles include Healthcare Data Analytics, Clinical Data Analyst, Healthcare Insurance Data Analyst, etc.
The overall goal is to assist in better healthcare delivery and cost savings for both the healthcare facility and the Patients.
C. Data Analytics in E-commerce and Retail
Data Analytics in E-commerce and Retail is in use in analyzing and tracking sales performance across multiple platforms, keeping track of product inventory, managing customer databases, monitoring customer search behavior, product recommendations, conversion rates, etc.
An eCommerce Data Analyst will identify opportunities, threats, challenges, and how customers interact with products and ultimately use insights gained through analytics to drive sales.
D. Data Analytics in Social Media and Big Tech

The big names in Social media and Big Tech (Twitter, Meta, TikTok, etc.) are big on users data. They use analytics on a large scale (Big Data) to better understand users’ behavior and make predictions on what might be good recommendations to users. Careers in this niche are usually very lucrative and research-driven. They deal with a large set of user data and there are opportunities at every level – from data collection, preparation, analyses, etc.
D. Data Analytics in Marketing and Advertising
Data analytics is used to monitor and measure the effectiveness of marketing campaigns by advertising and marketing agencies. The job role here may be that of an Analytical Lead, whose job it is to help advertisers with measurement, testing, and insights into marketing data to help grow their campaigns and reach better target audiences.
Tools And Technologies Used In Data Analytics
Data Analytics uses tools and technologies that make the collection, preparation, and analytics of data possible. These tools and technologies Include Visualization Tools, Programming languages, and Machine Language frameworks for more advanced analytics.
1. Data Visualization Tools (Tableau, Power BI)

Visualization Tools are used by Data analysts to present or share the insights or findings of Data Analytics in a form that can easily be understood or “visualized”. They are usually in the form of Charts, Maps, Graphs, or other visual aids. The most common Data Visualization tools include ;
- Tableau is used for creating interacting, graphs, charts, maps, etc in just minutes
- Power BI is similar to Tableau for visualization, except that it is a more general business Intelligence tool
- Microsoft Excel is an easy-to-use visualization tool, with various options.
- Zoho Analytics to create custom reports and dashboards.
2. Programming Languages (Python, R, SQL)
Programming languages are used to process data in different formats (Data wrangling) and are normally employed when you have a large data set. Python is a common Programming language used for this purpose. Another Programming language R is used for Statistical computing to complement Python. SQL (Structured Query Language) is used to access and manipulate Databases.
3. Machine Learning Frameworks (TensorFlow, PyTorch)
Machine learning frameworks are tools that provide a set of pre-built functions and libraries to simplify the development, training, and deployment of models for Data analytics. These frameworks are Training, Intermediary, or Deployment frameworks. There are several of these, the common ones are;
- TensorFlow – is a low-level Software library created by Google to create ML Models and solve complex numerical problems. It is free and open source.
- PyTorch – is a low-level API for natural language and computer vision. It was developed by Meta
- Keras – is a high-level deep-learning API. It is used for the implementation and computation of neural networks. It is written in Python. It is simple, easy to use, and can run on TensorFlow or PyTorch.
Conclusions
Data Analytics is the process of analyzing data to gain insights. It is the foundation of various career opportunities such as those of Data analysts, Business Intelligence analysts, Data scientists, and Data Engineers. These work across different industries such as healthcare, Advertising, Financial Institutions, Businesses, and E-commerce. Key skills in Data analytics include Data preparation, number crunching, story-telling, and Programming skills. Some useful tools in data analytics are Spreadsheets, Tableau, Power BI, and programming languages such as Python, and R SQL.
The salaries and opportunities are great for a career in Data Analytics and are worth exploring. It has much relevance in modern business environments.
Credits: https://chandoo.org/wp/advanced-excel-skills/ on learning Excel skills
Learn about some IT opportunities HEALTHCARE IT: INNOVATIONS AND CAREER